Relatório Trimestral

Carmignac P. Emerging Patrimoine: Letter from the Fund Managers
-
+6.6%Net return of Carmignac Portfolio Emerging Patrimoine
F EUR Acc in 2023 (year to date from 31/12/2022 to 30/06/2023).
-
1stCarmignac P. Emerging Patrimoine
F EUR Acc is ranked 1st quartile within its Morningstar category (Global EM Allocation) for its return over 1, 3 and 5 years.
-
+4.7%5-year annualized performance
versus +2.5% for the reference indicator over the period.
Carmignac P. Emerging Patrimoine gained +0.93% in the second quarter of 2023, while its reference indicator1 was up +1.38%. Since the beginning of the year, the Fund has recorded a performance of +6.6%, compared with +3.5% for its performance indicator (40% MSCI Emerging Markets NR USD (dividends net reinvested) + 40% JP Morgan GBI-EM Unhedged (EUR, coupons reinvested) + 20% ESTER capitalised, rebalanced quarterly).
Quarterly Performance Review
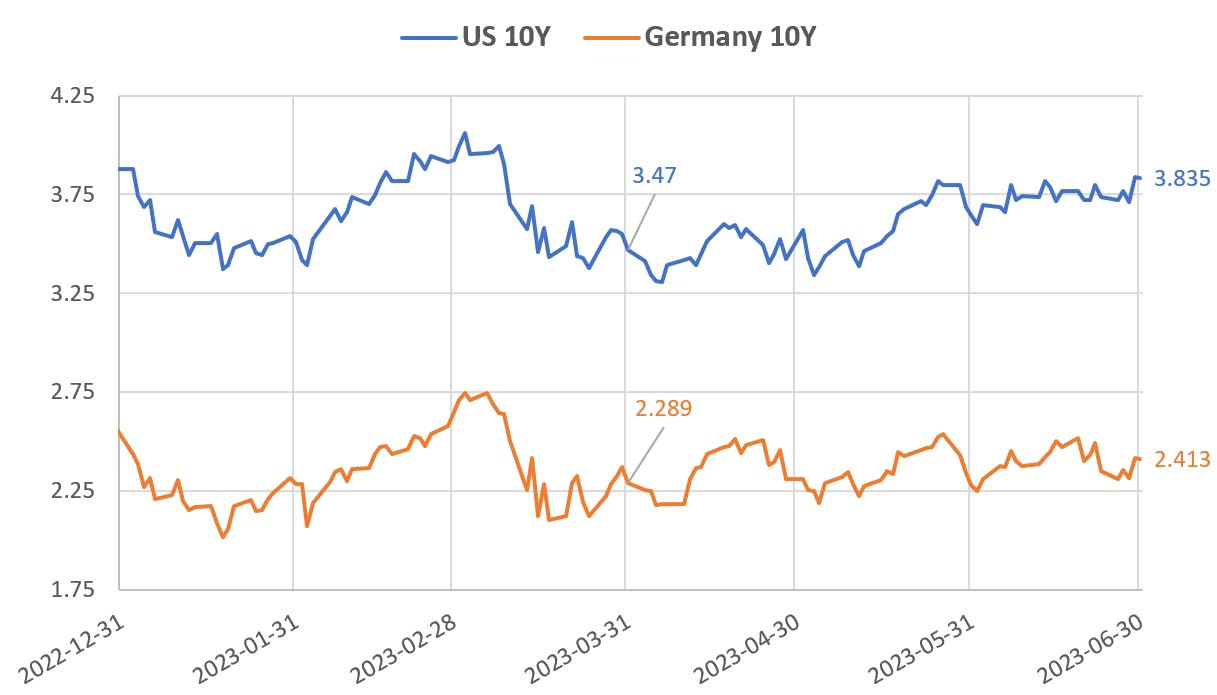
The second quarter has been characterized by a strong bullish sentiment in risky markets as well as higher global rates. The 10Y Treasury went from around 3.5% to over 3.8%, while the MSCI World added 3.7% of performance.
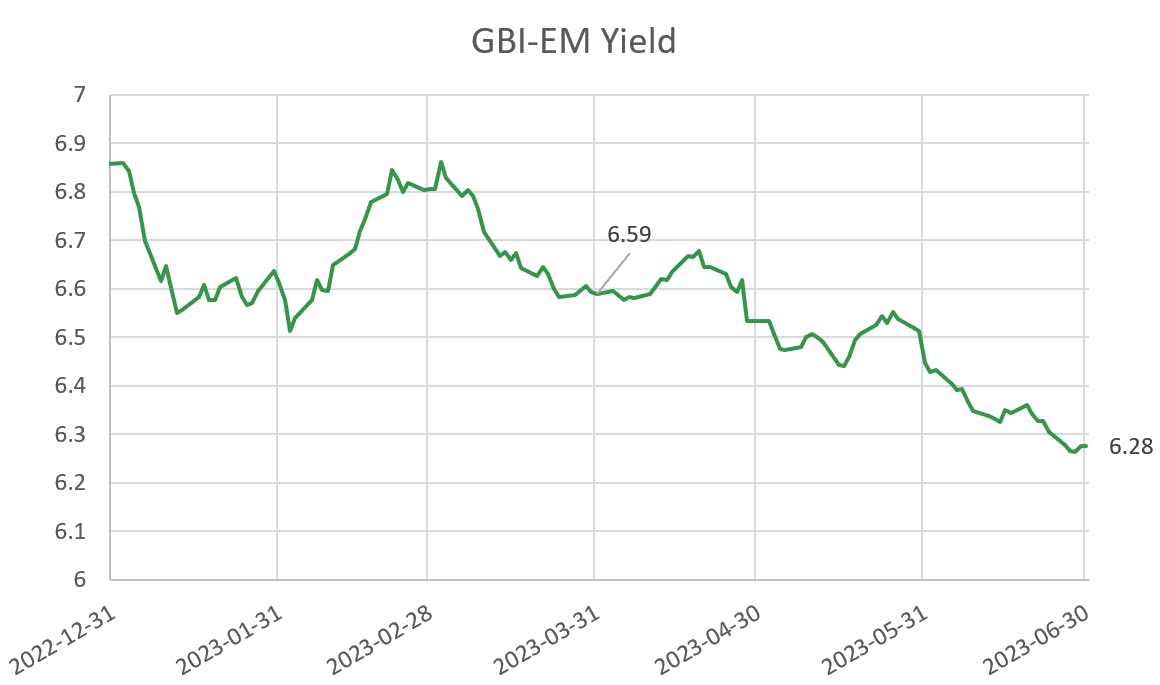
In terms of local rates we have continued to see a slowdown in the EM inflation (as well as DM inflation). In this context the local bonds performed particularly well with the GBI-EM index’s Yield dropping by 31 basis points over the quarter. We also saw the first rate cut in the EM universe this quarter with Hungary cutting twice by 100bps each time its overnight rate. We think that a number of countries are likely to follow in the next 2 quarters, such as Brazil, Chile, and Czechia.
Sources : Carmignac, Bloomberg, 30/06/2023.
Furthermore, FX despite the lower rates in EM retained a strong real carry and continued to attract investors with the exception of Asia suffering from its negative carry. We also saw that the political noise in Israel and South Africa (as well as power issues) significantly affected these currencies. For the sovereign credit we have seen a good performance with the EMBIGD index as a whole, but the EMBIGD HY outperformed with a compression of spreads by 60bps over the period.
1J.P Morgan EMBIG Diversified index hedged in EUR ;
2J.P Morgan EMBIG HY Diversified index hedged in EUR.

In the Equity space we had a disappointing quarter, in particular when looking at US or European Equities. Effectively China, a big weight in the index, dropped by 10.8% in Q2; a disappointing easing and lack of monetary intervention means that growth will not accelerate as much as was anticipated by the markets at the start of Q1 2023.
Sources : Carmignac, Bloomberg, 30/06/2023.

Sources : Carmignac, Bloomberg, 30/06/2023.
What have we done in this context
In this context we have benefitted from the Local Rates rally in the CZK, HUF, MXN and BRL curves. Following the rally we started to reduce as large interest rate cuts are starting to get priced, and the usual correlation between DM rates and these Local Curves seems to have broken during this quarter. In particular we have reduced the CZK, BRL and MXN rates.
In the FX space we continue to enjoy the carry and performance of EM FX currencies. Like in the previous quarter we have been long HUF, CZK, BRL, and MXN. During the quarter we reduced our HUF after its strong rally and as the central bank started to cut rates at a steep pace. We also used the weakness in ILS and ZAR to enter into tactical positions.
For the sovereign credit following the strong performance of the HY we took the chance to reduce the exposure of the fund while keeping our more IG names. Another important event was our purchase of Turkey CDS to protect the book but which paid off as Erdogan won the elections where we also reduced the protection. In terms of Equity we remained defensive during the quarter accelerating in the month of June our purchase of protective positions.
Outlook / How is the portfolio prepared for the following months
Looking forward we still expect a recession to hit the global economy: high rates are eating at demand an effect we are already largely seeing it in the EM world. Furthermore, China which last quarter was seen as launching a potentially large stimulus to boost growth, is showing that it is unwilling to repeat the policies of the past thus removing a possible source of global growth.
This view of recession and high rates is reflected in our portfolio construction, namely a large reduction of risk assets. We also remain focused on duration with the view that a recession would force DM central banks to cut rates and thus enable further cuts in the EM world.
This leaves us with EM FX which offer carry while having a central bank ready to defend the currency such as the CZK and the INR, as well as tactical/opportunist investments. In Local Rates we are ready to re-engage in the hikers notably in the BRL or HUF once the FED or ECB have paused and EM central banks can accelerate their cutting cycles. In Credit we remain cautious with protection against our HY names, and will keep our positioning light and focused on the IG space. Like for Credit in Equity we are going to remain defensive.
1Since the beginning of the year, the Fund has recorded a performance of +6.6%, compared with +3.5% for its performance indicator (40% MSCI Emerging Markets NR USD (dividends net reinvested) + 40% JP Morgan GBI-EM Unhedged (EUR, coupons reinvested) + 20% ESTER capitalised, rebalanced quarterly).
Carmignac Portfolio Emerging Patrimoine F EUR Acc
Horizonte de investimento mínimo recomendado
Risco mais baixo Risco mais elevado
. .
Ações: O Fundo pode ser afetado por variações nos preços das ações, numa escala que depende de fatores externos, volumes de negociação de ações ou capitalização bolsista.
Taxa de juro: O risco de taxa de juro resulta na diminuição do valor patrimonial líquido no caso de variações nas taxas de juro.
Crédito: O risco de crédito consiste no risco de incumprimento do emitente.
Países emergentes: As condições de funcionamento e de supervisão dos mercados "emergentes" podem desviar-se das normas em vigor nas principais praças mundiais e ter implicações nas cotações dos instrumentos cotados nos quais o Fundo pode investir.
Este fundo não possui capital garantido.
Carmignac Portfolio Emerging Patrimoine F EUR Acc
| 2014 | 2015 | 2016 | 2017 | 2018 | 2019 | 2020 | 2021 | 2022 | 2023 |
2024 (YTD) ? Desde o início do ano até à data |
|
|---|---|---|---|---|---|---|---|---|---|---|---|
| Carmignac Portfolio Emerging Patrimoine F EUR Acc | +5.95 % | +0.83 % | +10.46 % | +8.00 % | -13.80 % | +19.17 % | +21.06 % | -4.61 % | -9.00 % | +8.18 % | +1.38 % |
| Indicador de Referência | +9.38 % | -5.09 % | +13.97 % | +10.58 % | -5.84 % | +18.23 % | +1.51 % | +1.61 % | -8.39 % | +6.65 % | +2.03 % |
Deslocar para a direita para ver a tabela completa
| 3 anos | 5 anos | 10 anos | |
|---|---|---|---|
| Carmignac Portfolio Emerging Patrimoine F EUR Acc | -2.12 % | +5.64 % | +3.73 % |
| Indicador de Referência | -0.43 % | +2.71 % | +3.59 % |
Deslocar para a direita para ver a tabela completa
Fonte: Carmignac em 31/05/2024
| Custos de entrada : | Não cobramos uma comissão de subscrição. |
| Custos de saída : | Não cobramos uma comissão de saída para este produto. |
| Comissões de gestão e outros custos administrativos ou operacionais : | 1,16% O impacto dos custos que suportamos anualmente pela gestão dos seus investimentos e outras comissões administrativas. Esta é uma estimativa baseada nos custos efetivos ao longo do último ano. |
| Comissões de rendimento : | 20,00% quando a classe de ações supera o indicador de referência durante o período de desempenho. Será pago também no caso de a classe de ações ter superado o indicador de referência, mas teve um desempenho negativo. O baixo desempenho é recuperado por 5 anos. O valor real varia dependendo do desempenho do seu investimento. A estimativa de custo agregado acima inclui a média dos últimos 5 anos, ou desde a criação do produto se for inferior a 5 anos. |
| Custos de transação : | 0,71% O impacto dos custos inerentes às nossas operações de compra e de venda de investimentos subjacentes ao produto. |